

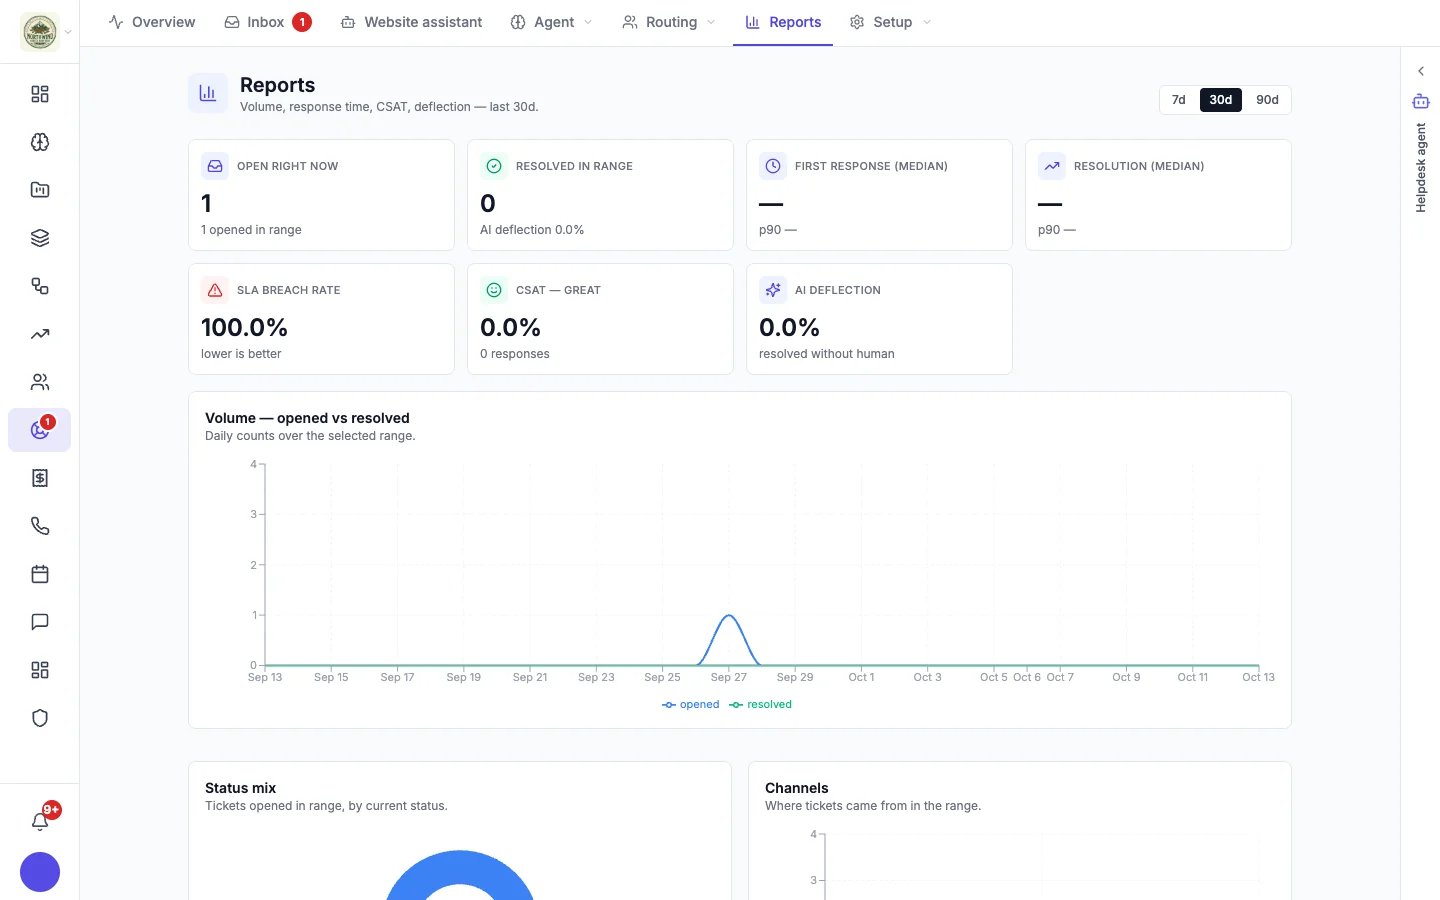
Helpdesk reports
Headline numbers
Charts
- Volume — opened vs resolved: daily counts, so you can see whether you are keeping up.
- Status mix: conversations opened in the range, by their current status.
- Channels: where conversations came from (website chat, email, phone, text).
- Priority mix: how urgent they were.
- CSAT trend: survey answers over time. If surveys are off, it says so, with a link to turn them on.
- CSAT responses: what customers actually said, newest first (up to 50 in the range).
- Top agents: teammates by conversations resolved, with their satisfaction score.